How to Set Up Private Managed Grafana and Prometheus for AKS with Terraform
Apr 23, 2025In most Azure Kubernetes Service (AKS) monitoring setups, resources like Prometheus and Grafana are configured by default with public endpoints. While this might be acceptable for development environments, production-grade clusters demand privacy and isolation, especially for organizations concerned about compliance, data sovereignty, and internal-only visibility.
This guide demonstrates how to set up a fully private monitoring solution using:
- Azure Monitor Managed Prometheus
- Managed Grafana
- Private AKS cluster
- Point-to-Site VPN with Private DNS
All communication is routed via private endpoints, and the solution uses Terraform for infrastructure provisioning.
By the end of this article, you will have a fully functional Terraform-based setup for deploying a private monitoring solution using Azure Managed Grafana and Prometheus.
Key Benefits:
- Complete elimination of public internet exposure
- Enterprise-grade security with private endpoints
- Managed services reduce operational overhead
- Terraform automation for reproducible deployments
Key Resources:
Architecture & Plan
The solution includes:
- A private AKS cluster (no public API access)
- Azure Monitor Workspace with Prometheus metrics enabled
- Azure Monitor Private Link Scope (AMPLS) for private ingestion
- Managed Grafana with public access disabled
- Private Endpoints for Prometheus, Grafana, and AMPLS
- Point-to-Site VPN for secure developer access (configured as per this VPN guide)
- DNS Inbound Endpoint for private name resolution
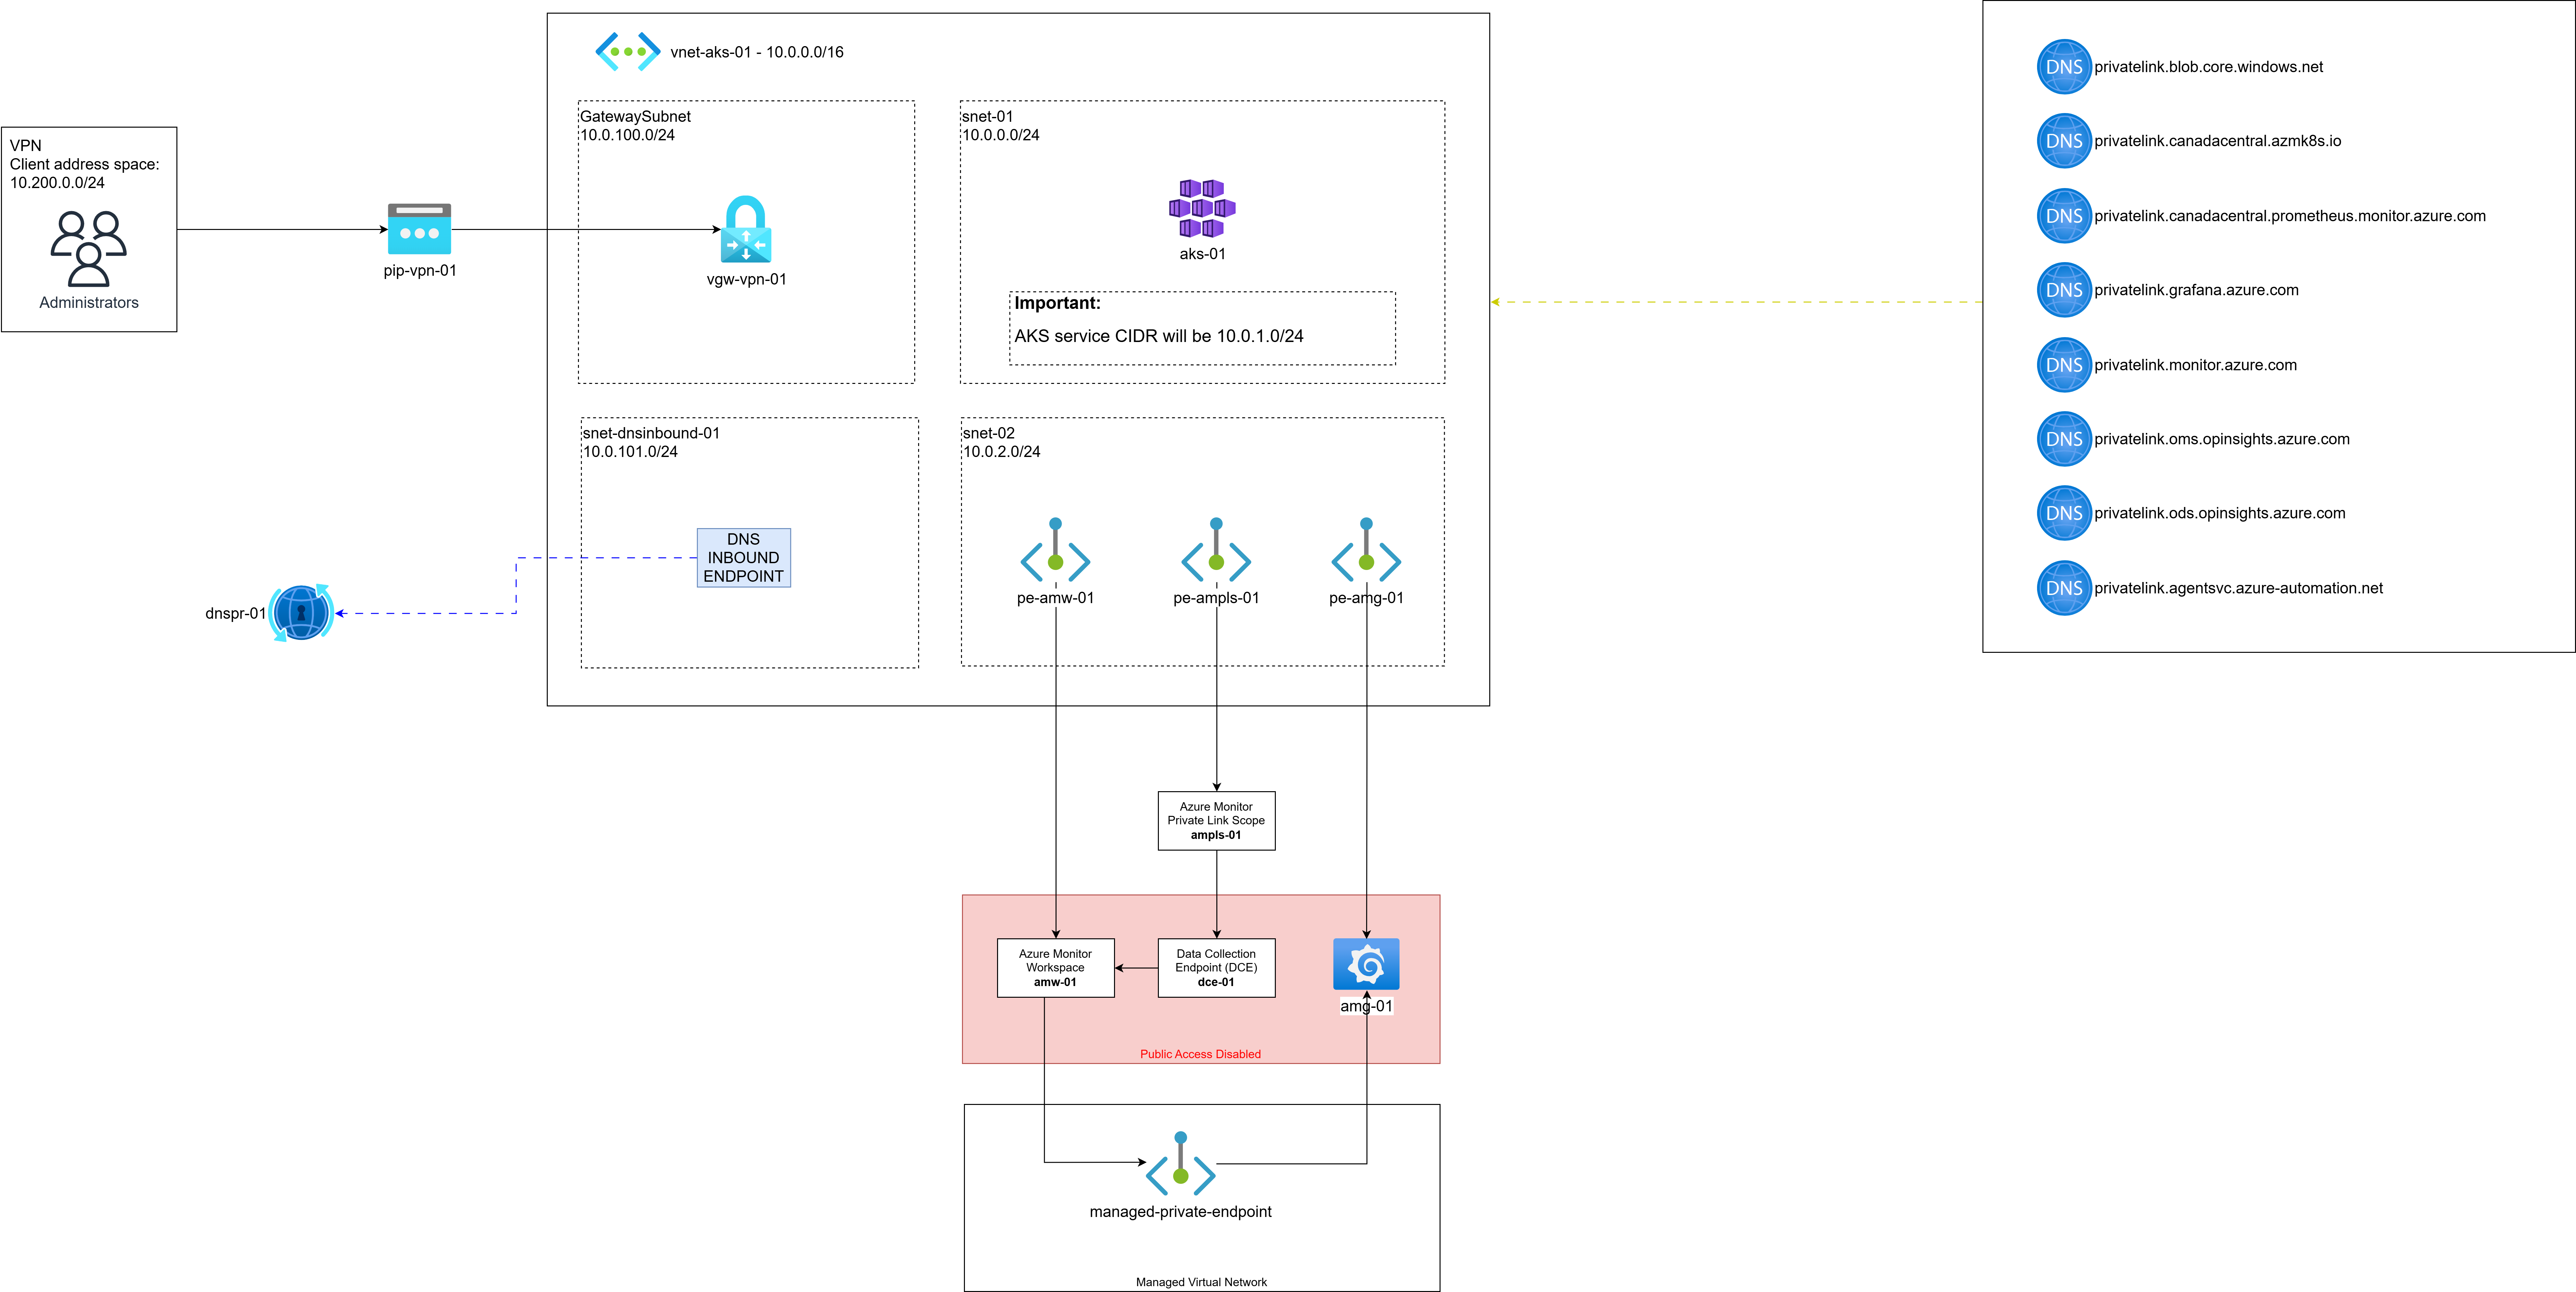
Figure 1: Complete private monitoring architecture showing all components and connections
In this article, we’ll walk through the following in order:
- Terraform setup and code overview
- Deploying private AKS and monitoring stack
- Approving the Grafana private endpoint
- Retrieving DNS inbound IP
- Connecting to the VPN
- Verifying logs in the Monitor Workspace
- Demonstrating VPN-only access to Grafana
- Accessing dashboards securely
Prerequisites
Before beginning, ensure you have:
- Azure CLI installed and authenticated
- Terraform installed
- Proper Azure permissions (Owner or Contributor + User Access Administrator)
- VPN client software (Azure VPN Client recommended)
Terraform Code Structure
Clone the project and inspect the following files:
git clone https://github.com/rceraline/devops.git
cd devops/2025-04-aks-private-monitoring
Folder Contents:
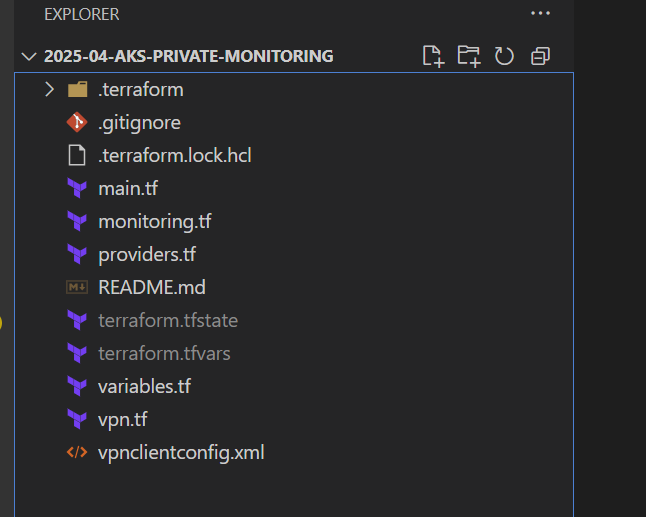
Figure 2: Git repository with the Terraform configuration files
Step 1: Terraform Code Breakdown
Here’s a detailed overview of what each file configures:
main.tf
locals {
  aks_name = "aks-01"
  all_private_dns_zone_names = [
    "privatelink.canadacentral.azmk8s.io",
    "privatelink.canadacentral.prometheus.monitor.azure.com",
    "privatelink.grafana.azure.com",
    "privatelink.blob.core.windows.net",        ## require for AMPLS
    "privatelink.monitor.azure.com",            ## require for AMPLS
    "privatelink.oms.opinsights.azure.com",     ## require for AMPLS
    "privatelink.ods.opinsights.azure.com",     ## require for AMPLS
    "privatelink.agentsvc.azure-automation.net" ## require for AMPLS
  ]
}

resource "azurerm_resource_group" "rg" {
  name     = "rg-aks-private-monitoring-01"
  location = "Canada Central"
}

## Network
resource "azurerm_virtual_network" "vnet" {
  name                = "vnet-01"
  location            = azurerm_resource_group.rg.location
  resource_group_name = azurerm_resource_group.rg.name
  address_space       = ["10.0.0.0/16"]
}

resource "azurerm_subnet" "snet_01" {
  name                 = "snet-01"
  address_prefixes     = ["10.0.0.0/24"]
  virtual_network_name = azurerm_virtual_network.vnet.name
  resource_group_name  = azurerm_resource_group.rg.name
}

resource "azurerm_subnet" "snet_02" {
  name                 = "snet-02"
  address_prefixes     = ["10.0.2.0/24"]
  virtual_network_name = azurerm_virtual_network.vnet.name
  resource_group_name  = azurerm_resource_group.rg.name
}

## Dns
resource "azurerm_private_dns_zone" "zones" {
  for_each = toset(local.all_private_dns_zone_names)

  name                = each.key
  resource_group_name = azurerm_resource_group.rg.name
}

resource "azurerm_private_dns_zone_virtual_network_link" "zone_links" {
  for_each = toset(local.all_private_dns_zone_names)

  name                  = each.key
  resource_group_name   = azurerm_resource_group.rg.name
  private_dns_zone_name = each.value
  virtual_network_id    = azurerm_virtual_network.vnet.id

  depends_on = [azurerm_private_dns_zone.zones]
}

## Identities
resource "azurerm_user_assigned_identity" "controlplane" {
  location            = azurerm_resource_group.rg.location
  name                = "id-controlplane-01"
  resource_group_name = azurerm_resource_group.rg.name
}

resource "azurerm_user_assigned_identity" "kubelet" {
  location            = azurerm_resource_group.rg.location
  name                = "id-kubelet-01"
  resource_group_name = azurerm_resource_group.rg.name
}

resource "azurerm_role_assignment" "controlplane_identity_contributor" {
  scope                = azurerm_user_assigned_identity.kubelet.id
  role_definition_name = "Managed Identity Contributor"
  principal_id         = azurerm_user_assigned_identity.controlplane.principal_id
}

resource "azurerm_role_assignment" "controlplane_resourcegroup_contributor" {
  scope                = azurerm_resource_group.rg.id
  role_definition_name = "Contributor"
  principal_id         = azurerm_user_assigned_identity.controlplane.principal_id
}

# AKS
resource "azurerm_kubernetes_cluster" "aks" {
  name                       = local.aks_name
  location                   = azurerm_resource_group.rg.location
  resource_group_name        = azurerm_resource_group.rg.name
  private_cluster_enabled    = true
  dns_prefix_private_cluster = local.aks_name
  private_dns_zone_id        = azurerm_private_dns_zone.zones["privatelink.canadacentral.azmk8s.io"].id
  sku_tier                   = "Standard"

  default_node_pool {
    name           = "system"
    node_count     = 3
    vm_size        = "Standard_D2s_v3"
    vnet_subnet_id = azurerm_subnet.snet_01.id

    upgrade_settings {
      drain_timeout_in_minutes      = 0
      max_surge                     = "10%"
      node_soak_duration_in_minutes = 0
    }
  }

  identity {
    type         = "UserAssigned"
    identity_ids = [azurerm_user_assigned_identity.controlplane.id]
  }

  kubelet_identity {
    client_id                 = azurerm_user_assigned_identity.kubelet.client_id
    object_id                 = azurerm_user_assigned_identity.kubelet.principal_id
    user_assigned_identity_id = azurerm_user_assigned_identity.kubelet.id
  }

  network_profile {
    network_plugin = "azure"
    dns_service_ip = "10.0.1.4"
    service_cidr   = "10.0.1.0/24"
  }

  monitor_metrics {
    annotations_allowed = null
    labels_allowed      = null
  }

  depends_on = [
    azurerm_role_assignment.controlplane_identity_contributor,
    azurerm_role_assignment.controlplane_resourcegroup_contributor,
  ]
}
- Declares AKS cluster and required infrastructure components:
- Resource group
- Virtual Network with 2 subnets (one for AKS and one for endpoints)
- Private DNS zones (8 in total, including Grafana and Azure Monitor zones ). Among these, 5 zones are mandatory for AMPLS to function correctly:
privatelink.blob.core.windows.netprivatelink.monitor.azure.comprivatelink.oms.opinsights.azure.comprivatelink.ods.opinsights.azure.comprivatelink.agentsvc.azure-automation.net
- User-assigned managed identities for control plane and kubelet
- Deploys a private AKS cluster (with private_cluster_enabled = true)
- Links the private DNS zones to the VNet for name resolution
This foundational block ensures a private, production-ready Kubernetes environment with DNS wired up for private endpoint resolution.
monitoring.tf
locals {
  monitor_workspace_name            = "amw-01"
  monitor_private_link_scope_name   = "ampls-01"
  monitor_data_collection_rule_name = "dcr-01"

  data_collection_endpoint_name = "dce-01"

  grafana_dashboard_name = "amg-01"
  grafana_version        = "11"

  ampls_private_dns_zones = [
    "privatelink.blob.core.windows.net",        ## require for AMPLS
    "privatelink.monitor.azure.com",            ## require for AMPLS
    "privatelink.oms.opinsights.azure.com",     ## require for AMPLS
    "privatelink.ods.opinsights.azure.com",     ## require for AMPLS
    "privatelink.agentsvc.azure-automation.net" ## require for AMPLS
  ]
}

##### Azure Monitor Workspace #######

resource "azurerm_monitor_workspace" "amw" {
  name                          = local.monitor_workspace_name
  resource_group_name           = azurerm_resource_group.rg.name
  location                      = azurerm_resource_group.rg.location
  public_network_access_enabled = false
}

resource "azurerm_monitor_data_collection_endpoint" "dce" {
  name                          = local.data_collection_endpoint_name
  resource_group_name           = azurerm_resource_group.rg.name
  location                      = azurerm_resource_group.rg.location
  kind                          = "Linux"
  public_network_access_enabled = false
}

resource "azurerm_private_endpoint" "amw" {
  name                = "pe-${local.monitor_workspace_name}"
  location            = azurerm_resource_group.rg.location
  resource_group_name = azurerm_resource_group.rg.name
  subnet_id           = azurerm_subnet.snet_02.id

  private_service_connection {
    name                           = "psc-${local.monitor_workspace_name}"
    private_connection_resource_id = azurerm_monitor_workspace.amw.id
    subresource_names              = ["prometheusMetrics"]
    is_manual_connection           = false
  }

  private_dns_zone_group {
    name                 = "pdzg-${local.monitor_workspace_name}"
    private_dns_zone_ids = [azurerm_private_dns_zone.zones["privatelink.canadacentral.prometheus.monitor.azure.com"].id]
  }
}

resource "azurerm_dashboard_grafana_managed_private_endpoint" "amw" {
  grafana_id                   = azurerm_dashboard_grafana.grafana.id
  name                         = "mpe-${local.monitor_workspace_name}"
  location                     = azurerm_resource_group.rg.location
  private_link_resource_id     = azurerm_monitor_workspace.amw.id
  group_ids                    = ["prometheusMetrics"]
  private_link_resource_region = azurerm_resource_group.rg.location
}

######### AMPLS ###############

resource "azurerm_monitor_private_link_scope" "ampls" {
  name                = local.monitor_private_link_scope_name
  resource_group_name = azurerm_resource_group.rg.name

  ingestion_access_mode = "PrivateOnly"
  query_access_mode     = "PrivateOnly"
}

resource "azurerm_monitor_private_link_scoped_service" "dce" {
  name                = "link-${local.monitor_private_link_scope_name}-dce"
  resource_group_name = azurerm_resource_group.rg.name
  scope_name          = azurerm_monitor_private_link_scope.ampls.name
  linked_resource_id  = azurerm_monitor_data_collection_endpoint.dce.id
}

## WORKAROUND: wait a couple of seconds before creating the AMPLS private endpoint
resource "time_sleep" "ampls_wait" {
  create_duration = "15s"
  depends_on      = [azurerm_monitor_private_link_scope.ampls]
}

resource "azurerm_private_endpoint" "ampls" {
  name                = "pe-${local.monitor_private_link_scope_name}"
  location            = azurerm_resource_group.rg.location
  resource_group_name = azurerm_resource_group.rg.name
  subnet_id           = azurerm_subnet.snet_02.id

  private_service_connection {
    name                           = "psc-${local.monitor_private_link_scope_name}"
    private_connection_resource_id = azurerm_monitor_private_link_scope.ampls.id
    subresource_names              = ["azuremonitor"]
    is_manual_connection           = false
  }

  private_dns_zone_group {
    name                 = "pdzg-${local.monitor_private_link_scope_name}"
    private_dns_zone_ids = [for zone in local.ampls_private_dns_zones : azurerm_private_dns_zone.zones[zone].id]
  }

  depends_on = [
    time_sleep.ampls_wait
  ]
}

#### Data Collection Rule and more... ####

resource "azurerm_monitor_data_collection_rule" "dcr" {
  name                        = local.monitor_data_collection_rule_name
  resource_group_name         = azurerm_resource_group.rg.name
  location                    = azurerm_resource_group.rg.location
  data_collection_endpoint_id = azurerm_monitor_data_collection_endpoint.dce.id
  kind                        = "Linux"

  destinations {
    monitor_account {
      monitor_account_id = azurerm_monitor_workspace.amw.id
      name               = "MonitoringAccount1"
    }
  }

  data_flow {
    streams      = ["Microsoft-PrometheusMetrics"]
    destinations = ["MonitoringAccount1"]
  }

  data_sources {
    prometheus_forwarder {
      streams = ["Microsoft-PrometheusMetrics"]
      name    = "PrometheusDataSource"
    }
  }

  description = "DCR for Azure Monitor Metrics Profile (Managed Prometheus)"

  depends_on = [azurerm_private_endpoint.ampls]
}

resource "azurerm_monitor_data_collection_rule_association" "dcra_rule" {
  name                    = "MSProm-${azurerm_resource_group.rg.location}-${local.aks_name}"
  target_resource_id      = azurerm_kubernetes_cluster.aks.id
  data_collection_rule_id = azurerm_monitor_data_collection_rule.dcr.id
  description             = "Association of data collection rule. Deleting this association will break the data collection for this AKS Cluster."
  depends_on = [
    azurerm_monitor_data_collection_rule.dcr
  ]
}

resource "azurerm_monitor_data_collection_rule_association" "dcra_endpoint" {
  name                        = "configurationAccessEndpoint"
  target_resource_id          = azurerm_kubernetes_cluster.aks.id
  data_collection_endpoint_id = azurerm_monitor_data_collection_endpoint.dce.id
  description                 = "Association of data collection endpoint. Deleting this association will break the data collection for this AKS Cluster."
}

######### Grafana ###########

resource "azurerm_dashboard_grafana" "grafana" {
  name                          = local.grafana_dashboard_name
  resource_group_name           = azurerm_resource_group.rg.name
  location                      = azurerm_resource_group.rg.location
  grafana_major_version         = local.grafana_version
  public_network_access_enabled = false

  identity {
    type = "SystemAssigned"
  }

  azure_monitor_workspace_integrations {
    resource_id = azurerm_monitor_workspace.amw.id
  }
}

resource "azurerm_private_endpoint" "grafana" {
  name                = "pe-${local.grafana_dashboard_name}"
  location            = azurerm_resource_group.rg.location
  resource_group_name = azurerm_resource_group.rg.name
  subnet_id           = azurerm_subnet.snet_02.id

  private_service_connection {
    name                           = "psc-${local.grafana_dashboard_name}"
    private_connection_resource_id = azurerm_dashboard_grafana.grafana.id
    subresource_names              = ["grafana"]
    is_manual_connection           = false
  }

  private_dns_zone_group {
    name                 = "pdzg-${local.grafana_dashboard_name}"
    private_dns_zone_ids = [azurerm_private_dns_zone.zones["privatelink.grafana.azure.com"].id]
  }
}

resource "azurerm_role_assignment" "monitoring_reader" {
  scope                = azurerm_monitor_workspace.amw.id
  role_definition_name = "Monitoring Reader"
  principal_id         = azurerm_dashboard_grafana.grafana.identity.0.principal_id
}

resource "azurerm_role_assignment" "datareaderrole" {
  scope              = azurerm_monitor_workspace.amw.id
  role_definition_id = "/subscriptions/${split("/", azurerm_monitor_workspace.amw.id)[2]}/providers/Microsoft.Authorization/roleDefinitions/b0d8363b-8ddd-447d-831f-62ca05bff136"
  principal_id       = azurerm_dashboard_grafana.grafana.identity.0.principal_id
}

resource "azurerm_role_assignment" "grafana_admin" {
  scope                = azurerm_dashboard_grafana.grafana.id
  role_definition_name = "Grafana Admin"
  principal_id         = var.current_user_principal_id
}

######## Prometheus rules ###########

resource "azurerm_monitor_alert_prometheus_rule_group" "node_recording_rules_rule_group" {
  name                = "NodeRecordingRulesRuleGroup-${local.aks_name}"
  location            = azurerm_resource_group.rg.location
  resource_group_name = azurerm_resource_group.rg.name
  cluster_name        = local.aks_name
  description         = "Node Recording Rules Rule Group"
  rule_group_enabled  = true
  interval            = "PT1M"
  scopes              = [azurerm_monitor_workspace.amw.id, azurerm_kubernetes_cluster.aks.id]

  rule {
    enabled    = true
    record     = "instance:node_num_cpu:sum"
    expression = <<EOF
count without (cpu, mode) (  node_cpu_seconds_total{job="node",mode="idle"})
EOF
  }
  rule {
    enabled    = true
    record     = "instance:node_cpu_utilisation:rate5m"
    expression = <<EOF
1 - avg without (cpu) (  sum without (mode) (rate(node_cpu_seconds_total{job="node", mode=~"idle|iowait|steal"}[5m])))
EOF
  }
  rule {
    enabled    = true
    record     = "instance:node_load1_per_cpu:ratio"
    expression = <<EOF
(  node_load1{job="node"}/  instance:node_num_cpu:sum{job="node"})
EOF
  }
  rule {
    enabled    = true
    record     = "instance:node_memory_utilisation:ratio"
    expression = <<EOF
1 - (  (    node_memory_MemAvailable_bytes{job="node"}    or    (      node_memory_Buffers_bytes{job="node"}      +      node_memory_Cached_bytes{job="node"}      +      node_memory_MemFree_bytes{job="node"}      +      node_memory_Slab_bytes{job="node"}    )  )/  node_memory_MemTotal_bytes{job="node"})
EOF
  }
  rule {
    enabled = true

    record     = "instance:node_vmstat_pgmajfault:rate5m"
    expression = <<EOF
rate(node_vmstat_pgmajfault{job="node"}[5m])
EOF
  }
  rule {
    enabled    = true
    record     = "instance_device:node_disk_io_time_seconds:rate5m"
    expression = <<EOF
rate(node_disk_io_time_seconds_total{job="node", device!=""}[5m])
EOF
  }
  rule {
    enabled    = true
    record     = "instance_device:node_disk_io_time_weighted_seconds:rate5m"
    expression = <<EOF
rate(node_disk_io_time_weighted_seconds_total{job="node", device!=""}[5m])
EOF
  }
  rule {
    enabled    = true
    record     = "instance:node_network_receive_bytes_excluding_lo:rate5m"
    expression = <<EOF
sum without (device) (  rate(node_network_receive_bytes_total{job="node", device!="lo"}[5m]))
EOF
  }
  rule {
    enabled    = true
    record     = "instance:node_network_transmit_bytes_excluding_lo:rate5m"
    expression = <<EOF
sum without (device) (  rate(node_network_transmit_bytes_total{job="node", device!="lo"}[5m]))
EOF
  }
  rule {
    enabled    = true
    record     = "instance:node_network_receive_drop_excluding_lo:rate5m"
    expression = <<EOF
sum without (device) (  rate(node_network_receive_drop_total{job="node", device!="lo"}[5m]))
EOF
  }
  rule {
    enabled    = true
    record     = "instance:node_network_transmit_drop_excluding_lo:rate5m"
    expression = <<EOF
sum without (device) (  rate(node_network_transmit_drop_total{job="node", device!="lo"}[5m]))
EOF
  }
}

resource "azurerm_monitor_alert_prometheus_rule_group" "kubernetes_recording_rules_rule_group" {
  name                = "KubernetesRecordingRulesRuleGroup-${local.aks_name}"
  location            = azurerm_resource_group.rg.location
  resource_group_name = azurerm_resource_group.rg.name
  cluster_name        = local.aks_name
  description         = "Kubernetes Recording Rules Rule Group"
  rule_group_enabled  = true
  interval            = "PT1M"
  scopes              = [azurerm_monitor_workspace.amw.id, azurerm_kubernetes_cluster.aks.id]

  rule {
    enabled    = true
    record     = "node_namespace_pod_container:container_cpu_usage_seconds_total:sum_irate"
    expression = <<EOF
sum by (cluster, namespace, pod, container) (  irate(container_cpu_usage_seconds_total{job="cadvisor", image!=""}[5m])) * on (cluster, namespace, pod) group_left(node) topk by (cluster, namespace, pod) (  1, max by(cluster, namespace, pod, node) (kube_pod_info{node!=""}))
EOF
  }
  rule {
    enabled    = true
    record     = "node_namespace_pod_container:container_memory_working_set_bytes"
    expression = <<EOF
container_memory_working_set_bytes{job="cadvisor", image!=""}* on (namespace, pod) group_left(node) topk by(namespace, pod) (1,  max by(namespace, pod, node) (kube_pod_info{node!=""}))
EOF
  }
  rule {
    enabled    = true
    record     = "node_namespace_pod_container:container_memory_rss"
    expression = <<EOF
container_memory_rss{job="cadvisor", image!=""}* on (namespace, pod) group_left(node) topk by(namespace, pod) (1,  max by(namespace, pod, node) (kube_pod_info{node!=""}))
EOF
  }
  rule {
    enabled    = true
    record     = "node_namespace_pod_container:container_memory_cache"
    expression = <<EOF
container_memory_cache{job="cadvisor", image!=""}* on (namespace, pod) group_left(node) topk by(namespace, pod) (1,  max by(namespace, pod, node) (kube_pod_info{node!=""}))
EOF
  }
  rule {
    enabled    = true
    record     = "node_namespace_pod_container:container_memory_swap"
    expression = <<EOF
container_memory_swap{job="cadvisor", image!=""}* on (namespace, pod) group_left(node) topk by(namespace, pod) (1,  max by(namespace, pod, node) (kube_pod_info{node!=""}))
EOF
  }
  rule {
    enabled    = true
    record     = "cluster:namespace:pod_memory:active:kube_pod_container_resource_requests"
    expression = <<EOF
kube_pod_container_resource_requests{resource="memory",job="kube-state-metrics"}  * on (namespace, pod, cluster)group_left() max by (namespace, pod, cluster) (  (kube_pod_status_phase{phase=~"Pending|Running"} == 1))
EOF
  }
  rule {
    enabled    = true
    record     = "namespace_memory:kube_pod_container_resource_requests:sum"
    expression = <<EOF
sum by (namespace, cluster) (    sum by (namespace, pod, cluster) (        max by (namespace, pod, container, cluster) (          kube_pod_container_resource_requests{resource="memory",job="kube-state-metrics"}        ) * on(namespace, pod, cluster) group_left() max by (namespace, pod, cluster) (          kube_pod_status_phase{phase=~"Pending|Running"} == 1        )    ))
EOF
  }
  rule {
    enabled    = true
    record     = "cluster:namespace:pod_cpu:active:kube_pod_container_resource_requests"
    expression = <<EOF
kube_pod_container_resource_requests{resource="cpu",job="kube-state-metrics"}  * on (namespace, pod, cluster)group_left() max by (namespace, pod, cluster) (  (kube_pod_status_phase{phase=~"Pending|Running"} == 1))
EOF
  }
  rule {
    enabled    = true
    record     = "namespace_cpu:kube_pod_container_resource_requests:sum"
    expression = <<EOF
sum by (namespace, cluster) (    sum by (namespace, pod, cluster) (        max by (namespace, pod, container, cluster) (          kube_pod_container_resource_requests{resource="cpu",job="kube-state-metrics"}        ) * on(namespace, pod, cluster) group_left() max by (namespace, pod, cluster) (          kube_pod_status_phase{phase=~"Pending|Running"} == 1        )    ))
EOF
  }
  rule {
    enabled    = true
    record     = "cluster:namespace:pod_memory:active:kube_pod_container_resource_limits"
    expression = <<EOF
kube_pod_container_resource_limits{resource="memory",job="kube-state-metrics"}  * on (namespace, pod, cluster)group_left() max by (namespace, pod, cluster) (  (kube_pod_status_phase{phase=~"Pending|Running"} == 1))
EOF
  }
  rule {
    enabled    = true
    record     = "namespace_memory:kube_pod_container_resource_limits:sum"
    expression = <<EOF
sum by (namespace, cluster) (    sum by (namespace, pod, cluster) (        max by (namespace, pod, container, cluster) (          kube_pod_container_resource_limits{resource="memory",job="kube-state-metrics"}        ) * on(namespace, pod, cluster) group_left() max by (namespace, pod, cluster) (          kube_pod_status_phase{phase=~"Pending|Running"} == 1        )    ))
EOF
  }
  rule {
    enabled    = true
    record     = "cluster:namespace:pod_cpu:active:kube_pod_container_resource_limits"
    expression = <<EOF
kube_pod_container_resource_limits{resource="cpu",job="kube-state-metrics"}  * on (namespace, pod, cluster)group_left() max by (namespace, pod, cluster) ( (kube_pod_status_phase{phase=~"Pending|Running"} == 1) )
EOF
  }
  rule {
    enabled    = true
    record     = "namespace_cpu:kube_pod_container_resource_limits:sum"
    expression = <<EOF
sum by (namespace, cluster) (    sum by (namespace, pod, cluster) (        max by (namespace, pod, container, cluster) (          kube_pod_container_resource_limits{resource="cpu",job="kube-state-metrics"}        ) * on(namespace, pod, cluster) group_left() max by (namespace, pod, cluster) (          kube_pod_status_phase{phase=~"Pending|Running"} == 1        )    ))
EOF
  }
  rule {
    enabled    = true
    record     = "namespace_workload_pod:kube_pod_owner:relabel"
    expression = <<EOF
max by (cluster, namespace, workload, pod) (  label_replace(    label_replace(      kube_pod_owner{job="kube-state-metrics", owner_kind="ReplicaSet"},      "replicaset", "$1", "owner_name", "(.*)"    ) * on(replicaset, namespace) group_left(owner_name) topk by(replicaset, namespace) (      1, max by (replicaset, namespace, owner_name) (        kube_replicaset_owner{job="kube-state-metrics"}      )    ),    "workload", "$1", "owner_name", "(.*)"  ))
EOF
    labels = {
      workload_type = "deployment"
    }
  }
  rule {
    enabled    = true
    record     = "namespace_workload_pod:kube_pod_owner:relabel"
    expression = <<EOF
max by (cluster, namespace, workload, pod) (  label_replace(    kube_pod_owner{job="kube-state-metrics", owner_kind="DaemonSet"},    "workload", "$1", "owner_name", "(.*)"  ))
EOF
    labels = {
      workload_type = "daemonset"
    }
  }
  rule {
    enabled    = true
    record     = "namespace_workload_pod:kube_pod_owner:relabel"
    expression = <<EOF
max by (cluster, namespace, workload, pod) (  label_replace(    kube_pod_owner{job="kube-state-metrics", owner_kind="StatefulSet"},    "workload", "$1", "owner_name", "(.*)"  ))
EOF
    labels = {
      workload_type = "statefulset"
    }
  }
  rule {
    enabled    = true
    record     = "namespace_workload_pod:kube_pod_owner:relabel"
    expression = <<EOF
max by (cluster, namespace, workload, pod) (  label_replace(    kube_pod_owner{job="kube-state-metrics", owner_kind="Job"},    "workload", "$1", "owner_name", "(.*)"  ))
EOF
    labels = {
      workload_type = "job"
    }
  }
  rule {
    enabled    = true
    record     = ":node_memory_MemAvailable_bytes:sum"
    expression = <<EOF
sum(  node_memory_MemAvailable_bytes{job="node"} or  (    node_memory_Buffers_bytes{job="node"} +    node_memory_Cached_bytes{job="node"} +    node_memory_MemFree_bytes{job="node"} +    node_memory_Slab_bytes{job="node"}  )) by (cluster)
EOF
  }
  rule {
    enabled    = true
    record     = "cluster:node_cpu:ratio_rate5m"
    expression = <<EOF
sum(rate(node_cpu_seconds_total{job="node",mode!="idle",mode!="iowait",mode!="steal"}[5m])) by (cluster) /count(sum(node_cpu_seconds_total{job="node"}) by (cluster, instance, cpu)) by (cluster)
EOF
  }
}

resource "azurerm_monitor_alert_prometheus_rule_group" "node_and_kubernetes_recording_rules_rule_group_win" {
  name                = "NodeAndKubernetesRecordingRulesRuleGroup-Win-${local.aks_name}"
  location            = azurerm_resource_group.rg.location
  resource_group_name = azurerm_resource_group.rg.name
  cluster_name        = local.aks_name
  description         = "Node and Kubernetes Recording Rules Rule Group for Windows Nodes"
  rule_group_enabled  = true
  interval            = "PT1M"
  scopes              = [azurerm_monitor_workspace.amw.id, azurerm_kubernetes_cluster.aks.id]

  rule {
    enabled    = true
    record     = "node:windows_node_filesystem_usage:"
    expression = <<EOF
max by (instance,volume)((windows_logical_disk_size_bytes{job="windows-exporter"} - windows_logical_disk_free_bytes{job="windows-exporter"}) / windows_logical_disk_size_bytes{job="windows-exporter"})
EOF
  }
  rule {
    enabled    = true
    record     = "node:windows_node_filesystem_avail:"
    expression = <<EOF
max by (instance, volume) (windows_logical_disk_free_bytes{job="windows-exporter"} / windows_logical_disk_size_bytes{job="windows-exporter"})
EOF
  }
  rule {
    enabled    = true
    record     = ":windows_node_net_utilisation:sum_irate"
    expression = <<EOF
sum(irate(windows_net_bytes_total{job="windows-exporter"}[5m]))
EOF
  }
  rule {
    enabled    = true
    record     = "node:windows_node_net_utilisation:sum_irate"
    expression = <<EOF
sum by (instance) ((irate(windows_net_bytes_total{job="windows-exporter"}[5m])))
EOF
  }
  rule {
    enabled    = true
    record     = ":windows_node_net_saturation:sum_irate"
    expression = <<EOF
sum(irate(windows_net_packets_received_discarded_total{job="windows-exporter"}[5m])) + sum(irate(windows_net_packets_outbound_discarded_total{job="windows-exporter"}[5m]))
EOF
  }
  rule {
    enabled    = true
    record     = "node:windows_node_net_saturation:sum_irate"
    expression = <<EOF
sum by (instance) ((irate(windows_net_packets_received_discarded_total{job="windows-exporter"}[5m]) + irate(windows_net_packets_outbound_discarded_total{job="windows-exporter"}[5m])))
EOF
  }
  rule {
    enabled    = true
    record     = "windows_pod_container_available"
    expression = <<EOF
windows_container_available{job="windows-exporter", container_id != ""} * on(container_id) group_left(container, pod, namespace) max(kube_pod_container_info{job="kube-state-metrics", container_id != ""}) by(container, container_id, pod, namespace)
EOF
  }
  rule {
    enabled    = true
    record     = "windows_container_total_runtime"
    expression = <<EOF
windows_container_cpu_usage_seconds_total{job="windows-exporter", container_id != ""} * on(container_id) group_left(container, pod, namespace) max(kube_pod_container_info{job="kube-state-metrics", container_id != ""}) by(container, container_id, pod, namespace)
EOF
  }
  rule {
    enabled    = true
    record     = "windows_container_memory_usage"
    expression = <<EOF
windows_container_memory_usage_commit_bytes{job="windows-exporter", container_id != ""} * on(container_id) group_left(container, pod, namespace) max(kube_pod_container_info{job="kube-state-metrics", container_id != ""}) by(container, container_id, pod, namespace)
EOF
  }
  rule {
    enabled    = true
    record     = "windows_container_private_working_set_usage"
    expression = <<EOF
windows_container_memory_usage_private_working_set_bytes{job="windows-exporter", container_id != ""} * on(container_id) group_left(container, pod, namespace) max(kube_pod_container_info{job="kube-state-metrics", container_id != ""}) by(container, container_id, pod, namespace)
EOF
  }
  rule {
    enabled    = true
    record     = "windows_container_network_received_bytes_total"
    expression = <<EOF
windows_container_network_receive_bytes_total{job="windows-exporter", container_id != ""} * on(container_id) group_left(container, pod, namespace) max(kube_pod_container_info{job="kube-state-metrics", container_id != ""}) by(container, container_id, pod, namespace)
EOF
  }
  rule {
    enabled    = true
    record     = "windows_container_network_transmitted_bytes_total"
    expression = <<EOF
windows_container_network_transmit_bytes_total{job="windows-exporter", container_id != ""} * on(container_id) group_left(container, pod, namespace) max(kube_pod_container_info{job="kube-state-metrics", container_id != ""}) by(container, container_id, pod, namespace)
EOF
  }
  rule {
    enabled    = true
    record     = "kube_pod_windows_container_resource_memory_request"
    expression = <<EOF
max by (namespace, pod, container) (kube_pod_container_resource_requests{resource="memory",job="kube-state-metrics"}) * on(container,pod,namespace) (windows_pod_container_available)
EOF
  }
  rule {
    enabled    = true
    record     = "kube_pod_windows_container_resource_memory_limit"
    expression = <<EOF
kube_pod_container_resource_limits{resource="memory",job="kube-state-metrics"} * on(container,pod,namespace) (windows_pod_container_available)
EOF
  }
  rule {
    enabled    = true
    record     = "kube_pod_windows_container_resource_cpu_cores_request"
    expression = <<EOF
max by (namespace, pod, container) ( kube_pod_container_resource_requests{resource="cpu",job="kube-state-metrics"}) * on(container,pod,namespace) (windows_pod_container_available)
EOF
  }
  rule {
    enabled    = true
    record     = "kube_pod_windows_container_resource_cpu_cores_limit"
    expression = <<EOF
kube_pod_container_resource_limits{resource="cpu",job="kube-state-metrics"} * on(container,pod,namespace) (windows_pod_container_available)
EOF
  }
  rule {
    enabled    = true
    record     = "namespace_pod_container:windows_container_cpu_usage_seconds_total:sum_rate"
    expression = <<EOF
sum by (namespace, pod, container) (rate(windows_container_total_runtime{}[5m]))
EOF
  }
}

resource "azurerm_monitor_alert_prometheus_rule_group" "node_recording_rules_rule_group_win" {
  name                = "NodeRecordingRulesRuleGroup-Win-${local.aks_name}"
  location            = azurerm_resource_group.rg.location
  resource_group_name = azurerm_resource_group.rg.name
  cluster_name        = local.aks_name
  description         = "Node and Kubernetes Recording Rules Rule Group for Windows Nodes"
  rule_group_enabled  = true
  interval            = "PT1M"
  scopes              = [azurerm_monitor_workspace.amw.id, azurerm_kubernetes_cluster.aks.id]

  rule {
    enabled    = true
    record     = "node:windows_node:sum"
    expression = <<EOF
count (windows_system_system_up_time{job="windows-exporter"})
EOF
  }
  rule {
    enabled    = true
    record     = "node:windows_node_num_cpu:sum"
    expression = <<EOF
count by (instance) (sum by (instance, core) (windows_cpu_time_total{job="windows-exporter"}))
EOF
  }
  rule {
    enabled    = true
    record     = ":windows_node_cpu_utilisation:avg5m"
    expression = <<EOF
1 - avg(rate(windows_cpu_time_total{job="windows-exporter",mode="idle"}[5m]))
EOF
  }
  rule {
    enabled    = true
    record     = "node:windows_node_cpu_utilisation:avg5m"
    expression = <<EOF
1 - avg by (instance) (rate(windows_cpu_time_total{job="windows-exporter",mode="idle"}[5m]))
EOF
  }
  rule {
    enabled    = true
    record     = ":windows_node_memory_utilisation:"
    expression = <<EOF
1 -sum(windows_memory_available_bytes{job="windows-exporter"})/sum(windows_os_visible_memory_bytes{job="windows-exporter"})
EOF
  }
  rule {
    enabled    = true
    record     = ":windows_node_memory_MemFreeCached_bytes:sum"
    expression = <<EOF
sum(windows_memory_available_bytes{job="windows-exporter"} + windows_memory_cache_bytes{job="windows-exporter"})
EOF
  }
  rule {
    enabled    = true
    record     = "node:windows_node_memory_totalCached_bytes:sum"
    expression = <<EOF
(windows_memory_cache_bytes{job="windows-exporter"} + windows_memory_modified_page_list_bytes{job="windows-exporter"} + windows_memory_standby_cache_core_bytes{job="windows-exporter"} + windows_memory_standby_cache_normal_priority_bytes{job="windows-exporter"} + windows_memory_standby_cache_reserve_bytes{job="windows-exporter"})
EOF
  }
  rule {
    enabled    = true
    record     = ":windows_node_memory_MemTotal_bytes:sum"
    expression = <<EOF
sum(windows_os_visible_memory_bytes{job="windows-exporter"})
EOF
  }
  rule {
    enabled    = true
    record     = "node:windows_node_memory_bytes_available:sum"
    expression = <<EOF
sum by (instance) ((windows_memory_available_bytes{job="windows-exporter"}))
EOF
  }
  rule {
    enabled    = true
    record     = "node:windows_node_memory_bytes_total:sum"
    expression = <<EOF
sum by (instance) (windows_os_visible_memory_bytes{job="windows-exporter"})
EOF
  }
  rule {
    enabled    = true
    record     = "node:windows_node_memory_utilisation:ratio"
    expression = <<EOF
(node:windows_node_memory_bytes_total:sum - node:windows_node_memory_bytes_available:sum) / scalar(sum(node:windows_node_memory_bytes_total:sum))
EOF
  }
  rule {
    enabled    = true
    record     = "node:windows_node_memory_utilisation:"
    expression = <<EOF
1 - (node:windows_node_memory_bytes_available:sum / node:windows_node_memory_bytes_total:sum)
EOF
  }
  rule {
    enabled    = true
    record     = "node:windows_node_memory_swap_io_pages:irate"
    expression = <<EOF
irate(windows_memory_swap_page_operations_total{job="windows-exporter"}[5m])
EOF
  }
  rule {
    enabled    = true
    record     = ":windows_node_disk_utilisation:avg_irate"
    expression = <<EOF
avg(irate(windows_logical_disk_read_seconds_total{job="windows-exporter"}[5m]) + irate(windows_logical_disk_write_seconds_total{job="windows-exporter"}[5m]))
EOF
  }
  rule {
    enabled    = true
    record     = "node:windows_node_disk_utilisation:avg_irate"
    expression = <<EOF
avg by (instance) ((irate(windows_logical_disk_read_seconds_total{job="windows-exporter"}[5m]) + irate(windows_logical_disk_write_seconds_total{job="windows-exporter"}[5m])))
EOF
  }
}
This is the central component of the private monitoring setup, responsible for configuring the full end-to-end telemetry flow between AKS, Azure Monitor, and Managed Grafana — entirely via private connectivity.
It performs the following:
-
Creates an Azure Monitor Workspace with
public_network_access_enabled = falseto store Prometheus metrics.Deploys a Data Collection Endpoint (DCE) to receive metrics from the AKS cluster.
-
Creates a Private Endpoint for the Prometheus ingestion surface of the Monitor Workspace.
-
Deploys Managed Grafana with public access disabled, including a private endpoint for VPN-only access.
-
Establishes an Azure Monitor Private Link Scope (AMPLS) to route DCE ingestion privately, and links the DCE to it.
-
Adds a required 15-second delay (
time_sleep) to avoid race conditions when creating the AMPLS private endpoint. -
Configures Data Collection Rule (DCR) and associates it with the AKS cluster along with the DCE.
-
Creates a Managed Private Endpoint from Grafana to the Monitor Workspace, which must be manually approved post-deployment.
-
Assigns necessary RBAC roles:
- Monitoring Reader
- Azure Monitor Data Reader (custom role ID)
- Grafana Admin (to the current user)
Additionally, this file declares Prometheus recording rule groups to enrich observability across both Linux and Windows nodes, including:
azurerm_monitor_alert_prometheus_rule_groupfor:- Node metrics: CPU, memory, disk I/O, network I/O
- Kubernetes metrics: container usage, limits, resource requests
- Windows-specific metrics: logical disk usage, swap, networking, and container stats
These rules are organized into dedicated rule groups for:
- Linux Nodes
- Kubernetes Workloads
- Windows Nodes
Together, monitoring.tf orchestrates the full private observability backend, enabling AKS to push metrics into Azure Monitor, and Grafana to query them securely — all without public exposure
vpn.tf
locals {
  dns_subnet_name             = "snet-dnsinbound-01"
  dns_subnet_address_prefixes = ["10.0.101.0/24"]
  private_dns_resolver_name   = "dnspr-01"
  dns_inbound_endpoint_name   = "dnsinbound-endpoint-01"

  vpn_subnet_name             = "GatewaySubnet"
  vpn_subnet_address_prefixes = ["10.0.100.0/24"]
  vpn_pip_name                = "pip-vpn-01"
  vpn_gateway_name            = "vgw-vpn-01"
  vpn_client_address_space    = ["10.200.0.0/24"]
  vpn_public_cert_data        = <<EOF
MIIC9TCCAd2gAwIBAgIQHAzVMIc/aY5JxYQjgH0iXTANBgkqhkiG9w0BAQsFADAd
MRswGQYDVQQDDBJWcG5Sb290Q2VydGlmaWNhdGUwHhcNMjUwMTIwMjExNDE4WhcN
MjYwMTIwMjEzNDE4WjAdMRswGQYDVQQDDBJWcG5Sb290Q2VydGlmaWNhdGUwggEi
MA0GCSqGSIb3DQEBAQUAA4IBDwAwggEKAoIBAQC62jOML+5NCw7O+U6PMc/zNMDV
5F+7qaJK08SnKy4iiD1rPq8TI5HGXJg+6wrhmgFYTLLzY8VpRhfJblrXNs5vgc2m
v+H9LjFBRc0QtMI8+2j+gmpYiaaQk3KNESP1JNvz6uOvPhAjwjCWE7wzJzUiBzL+
JShAhwG6e2DKYt8zyYWsy51Myeqx7hMCqTb/NZRSxKKUTqC4qU/NlGW+7oIkbsl1
2YZ0stgWnxx21uK6flG29C6sxfDPyENoRiCrw8t+YH0iJPKm9i98GM6qu/gALA2G
6wRtKGjFf5ZDpDMycUO6LekggF+h8Ry/PAOILFypTQpfZ6ybHXukHh2SdVh9AgMB
AAGjMTAvMA4GA1UdDwEB/wQEAwICBDAdBgNVHQ4EFgQUlfJPhTGCjK4x3q4iAi0Y
naKJNMowDQYJKoZIhvcNAQELBQADggEBAJyjEwGTzv0/6+UtesgPg0G+YIvgP7vj
ZMKANqeaypTdru3acsTcChJCmjtSA7ufBlZOhIwCWnzxY5b8Ugiuqnqv7oPWkr1u
Wl937ZLR+lHhywVQRGBzGKOo7JFlB/SiGr4F90Oq6fgZvBU0DlwPb8jo//t576R/
pt+616/9TcmWNu5Hoptb208e5x8sjMpCzalimxFx6xicSzJ2IDwEW5aaVKwJGho/
x4EkA6x5CAmBNbzSM4Xcptijkc125DNPzD8tn1PGgqu4xknNCW8XNbDhyi9WGsV8
t2XTIPZtX8fjUMlxxt72/FWRdm7ErQnz186/P+5zwAcIqvQjBSDfyzs=
EOF
}

resource "azurerm_subnet" "gateway" {
  name                 = local.vpn_subnet_name
  address_prefixes     = local.vpn_subnet_address_prefixes
  virtual_network_name = azurerm_virtual_network.vnet.name
  resource_group_name  = azurerm_resource_group.rg.name
}

resource "azurerm_public_ip" "vpn" {
  name                = local.vpn_pip_name
  location            = azurerm_resource_group.rg.location
  resource_group_name = azurerm_resource_group.rg.name
  allocation_method   = "Static"
}

resource "azurerm_virtual_network_gateway" "vpn" {
  name                = local.vpn_gateway_name
  location            = azurerm_resource_group.rg.location
  resource_group_name = azurerm_resource_group.rg.name

  type     = "Vpn"
  vpn_type = "RouteBased"

  active_active = false
  enable_bgp    = false
  sku           = "VpnGw1"

  ip_configuration {
    name                          = "vnetGatewayConfig"
    public_ip_address_id          = azurerm_public_ip.vpn.id
    private_ip_address_allocation = "Dynamic"
    subnet_id                     = azurerm_subnet.gateway.id
  }

  vpn_client_configuration {
    address_space        = local.vpn_client_address_space
    vpn_client_protocols = ["OpenVPN"]

    root_certificate {
      name = "VpnRoot"

      public_cert_data = local.vpn_public_cert_data
    }
  }
}

## DNS
resource "azurerm_subnet" "dns_inbound" {
  name                 = local.dns_subnet_name
  address_prefixes     = local.dns_subnet_address_prefixes
  virtual_network_name = azurerm_virtual_network.vnet.name
  resource_group_name  = azurerm_resource_group.rg.name

  delegation {
    name = "Microsoft.Network.dnsResolvers"
    service_delegation {
      actions = ["Microsoft.Network/virtualNetworks/subnets/join/action"]
      name    = "Microsoft.Network/dnsResolvers"
    }
  }
}

resource "azurerm_private_dns_resolver" "dnspr" {
  name                = local.private_dns_resolver_name
  resource_group_name = azurerm_resource_group.rg.name
  location            = azurerm_resource_group.rg.location
  virtual_network_id  = azurerm_virtual_network.vnet.id
}

resource "azurerm_private_dns_resolver_inbound_endpoint" "inbound" {
  name                    = local.dns_inbound_endpoint_name
  private_dns_resolver_id = azurerm_private_dns_resolver.dnspr.id
  location                = azurerm_private_dns_resolver.dnspr.location

  ip_configurations {
    subnet_id = azurerm_subnet.dns_inbound.id
  }
}
- Adds secure developer access via a Point-to-Site VPN
- Creates:
- Gateway subnet and VPN gateway with OpenVPN config
- Static public IP for VPN gateway
- DNS subnet and inbound endpoint using Private DNS Resolver
- The VPN client is configured with a certificate (provided in the script) for secure authentication
- The DNS Inbound Endpoint is used for name resolution of private zones from your machine once VPN is connected
This setup ensures that external access to Grafana and metrics is possible only through VPN.
providers.tf
Defines the required Terraform provider (azurerm >= 4.26.0)
and sets up the Azure subscription context.
terraform {
  required_providers {
    azurerm = {
      source  = "hashicorp/azurerm"
      version = ">=4.26.0"
    }
  }
}

provider "azurerm" {
  subscription_id = "{subscription ID}" // update with your subscription ID
  features {
  }
}
variables.tf
Includes one required input:
variable "current_user_principal_id" {
  type        = string
  description = "Principal ID of the current user."
}
You can retrieve current_user_principal_id using:
az ad signed-in-user show --query id
Set the value of current_user_principal_id variable with PowerShell or add a terraform.tfvars to the solution:
$env:TF_VAR_current_user_principal_id = $(az ad signed-in-user show --query id)
Step 2: Deploy Infrastructure
Once everything is configured, initialize and deploy:
terraform init
terraform plan
terraform apply
Note: VPN Gateway creation may take 30–45 minutes to complete.
Step 3: Approve Grafana Managed Private Endpoint
After deployment, go to:
Azure Monitor Workspace → Networking → Private Access
You’ll see a Pending connection from Grafana. Click Approve as shown in Figure 3.
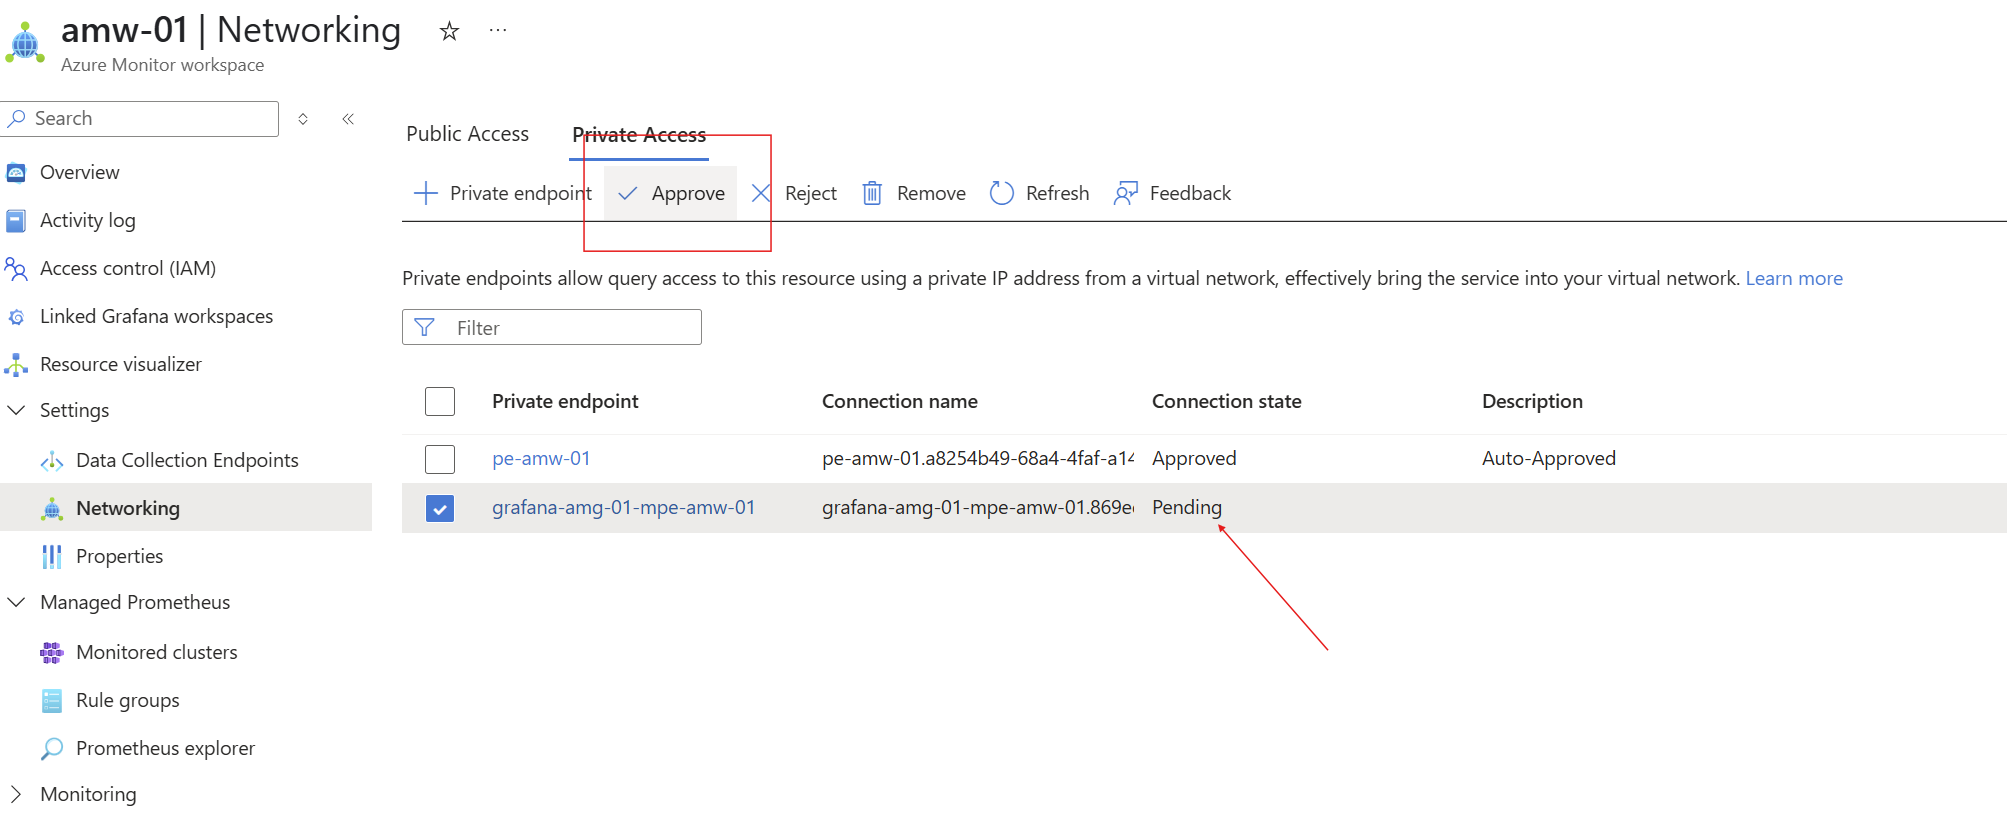
Figure 3: Grafana private endpoints to be approved
Step 4: Verify Prometheus Metrics
In Azure Portal:
- Go to Monitor Workspace
- Search for Prometheus Explorer
- Confirm that metrics are visible

Figure 4: Prometheus connected successfully and data is coming
Step 5: Access Grafana
Before proceeding, ensure you are connected to the VPN, as access to Grafana is restricted to private network traffic. If you haven’t set up the VPN yet, follow this detailed VPN setup guide, which walks through configuring the client certificate and DNS resolution.
- Connected to VPN → Grafana opens successfully

Figure 5: Azure VPN Client is connected
- Go to Data Sources →Managed_prometheus_amw-01→ Save & Test

Figure 6: Grafana can successfully Prometheus
Then, access the AKS Dashboards to view insights.
Step 6: Verify Prometheus Metrics
In Grafana Portal:
- Go to Dashboard
- Search for Azure Managed Prometheus
- Go to Kubernetes / Compute Resources / Cluster
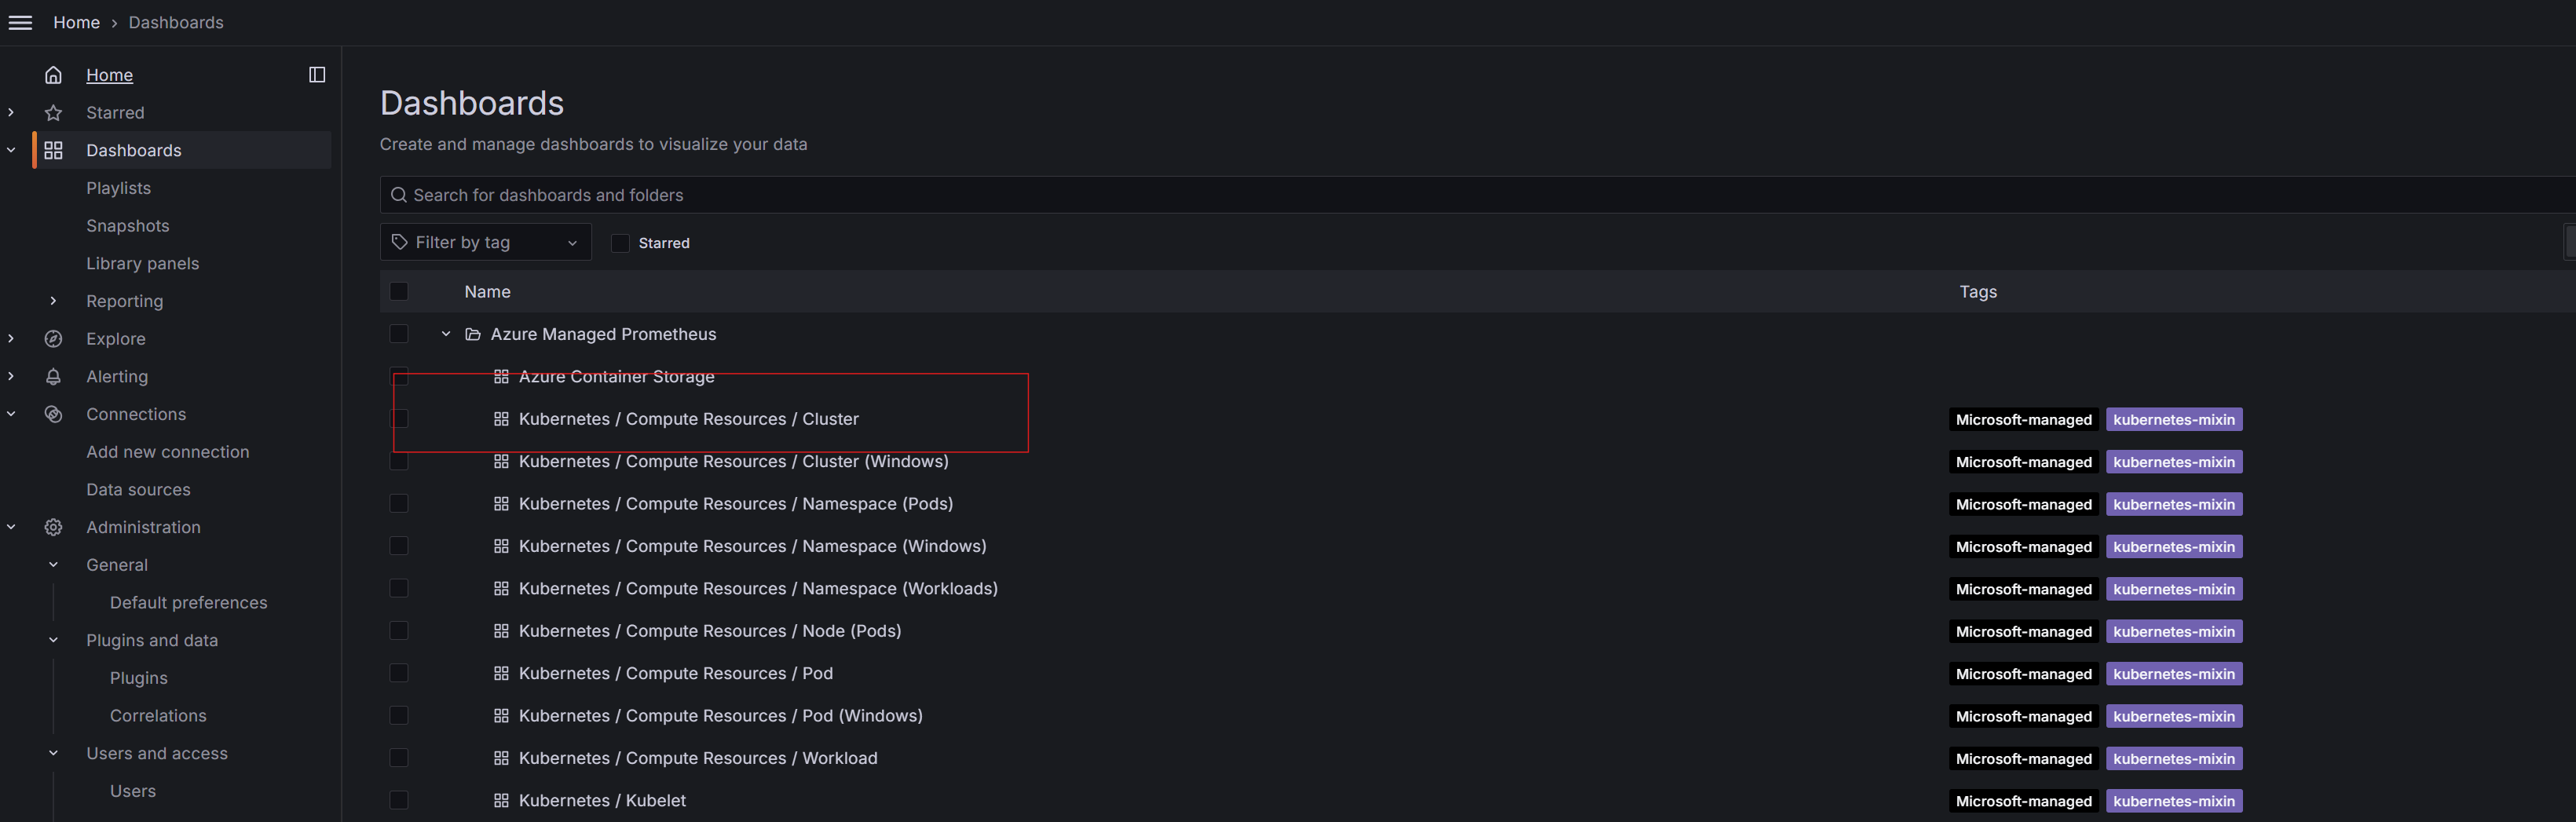
Figure 7: Grafana Dashboard
- Confirm that the data coming from Prometheus is visible
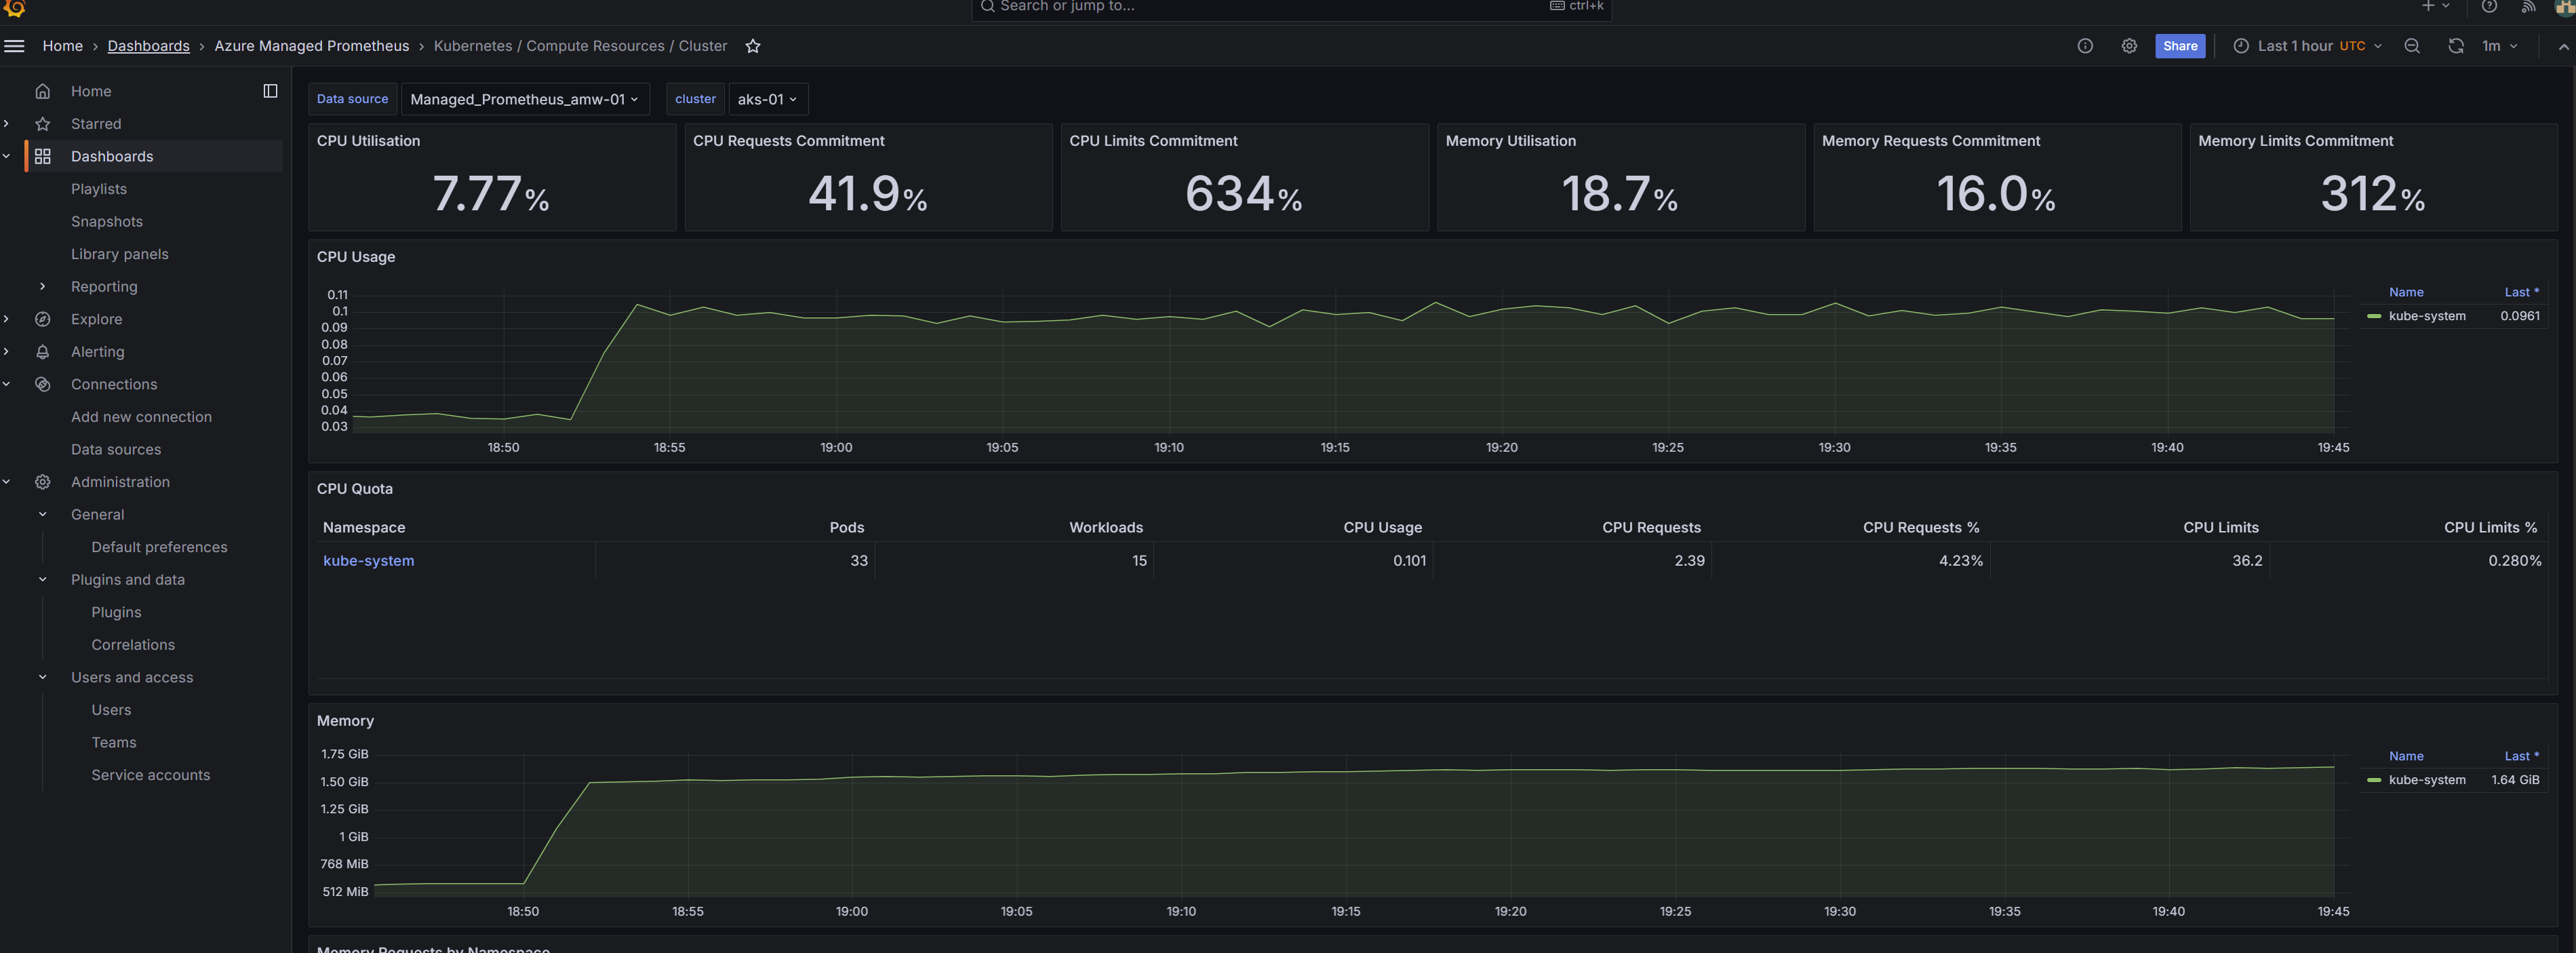
Figure 8: Data coming from Prometheus
Troubleshooting
| Problem | Solution |
|---|---|
| Private endpoint creation fails | Ensure time_sleep is applied after AMPLS |
| No DNS resolution | Verify all private DNS zones are linked to VNet |
| Grafana can't query metrics | Make sure the managed private endpoint is approved |
| No Prometheus data | Confirm DCR/DCE associations are in place |
| VPN doesn’t connect | Re-download or reconfigure VPN client certs |
Conclusion
By following this guide, you now have a fully private and secure monitoring stack for Azure Kubernetes Service using Terraform. The setup leverages Azure Managed Grafana and Azure Monitor Metrics (Prometheus) with private endpoints, which are further protected with a VPN-based access layer. This solution eliminates any public exposure, ensuring compliance and enhancing security for production-grade environments. With modular Terraform code, proper DNS setup, and VPN-secured access, you are fully equipped to monitor AKS workloads in a private cloud-native way.
References
Author